

How to Use TradingView with Deriv for Smarter Trading
📈 Learn how to connect TradingView with Deriv for smarter trading. Step-by-step setup, pro tips, and solutions for smoother trades in Pakistan.
Edited By
Laura Mitchell
For traders in Pakistan, keeping up with clear, real-time market analysis often feels like trying to catch smoke with bare hands. The Deriv platform already provides a solid base for trading, but combining it with TradingView charts can seriously level up your game. This guide breaks down how to integrate TradingView’s powerful charting tools right into Deriv, making your trading setup smoother and smarter without flipping between different platforms.
TradingView offers advanced technical indicators, customizable chart styles, and interactive features that many traders swear by. When you bring these into Deriv, you’re not just getting prettier graphs; you’re gaining a toolkit that helps you spot trends early, react quicker, and tailor your trades more precisely. This is especially useful in Pakistan’s market environment, where access to comprehensive analysis tools can be patchy.
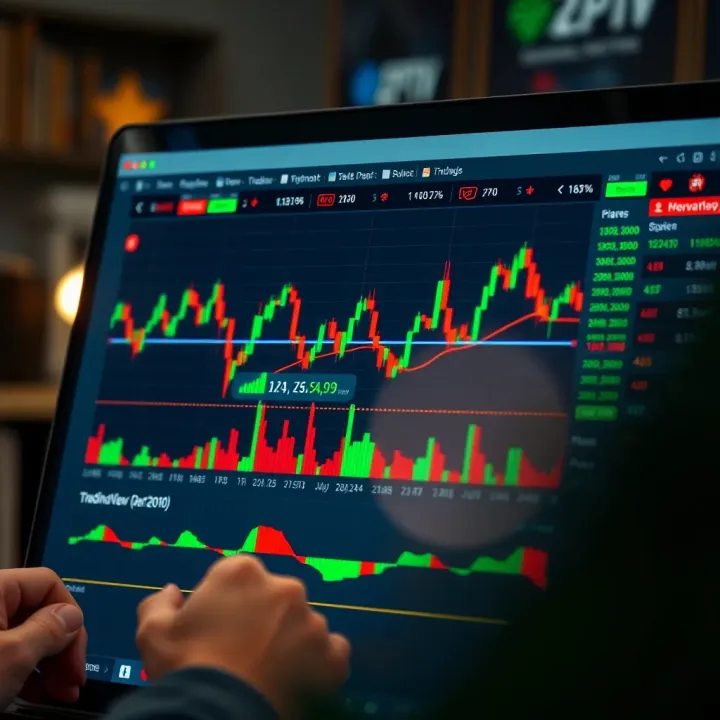
Here’s what you can expect from this guide:
Why embedding TradingView into Deriv makes a difference for traders in Pakistan
How to set up and configure TradingView charts within Deriv
Tips for customizing indicators to fit your trading style
Common pitfalls and how to avoid them
Practical examples to help you get started right away
Trading isn’t just about buying low and selling high — it's about making informed moves based on reliable data. So, let’s dig into the nuts and bolts of how TradingView can enhance your Deriv experience and help you trade more confidently.
Merging TradingView with the Deriv platform becomes a smart move, especially for traders aiming to get a sharper edge in the market. TradingView brings powerful charting and technical analysis tools, while Deriv provides a user-friendly platform tailored for various financial instruments. When these two work together, traders — particularly those in Pakistan where market nuances might differ — can access a richer toolkit to make informed decisions.
By combining these platforms, traders avoid flipping back and forth between tools, cutting down on the guesswork and lag time that often comes with using separate systems. For example, a Pakistani trader observing currency pair fluctuations can analyze detailed TradingView charts embedded directly into Deriv, spotting patterns faster without jumping through multiple tabs.
TradingView offers chart options far beyond the basics. You get high-quality candlestick charts, renko charts, and even point and figure charts that many other platforms lack. These tools are vital when you want to break down market movements clearly. For instance, renko charts filter out market noise by focusing on price movement rather than time, helping traders spot trends that might go unnoticed otherwise. This hands-on access speeds up recognizing entry and exit points on Deriv, ultimately helping to refine your trading strategy.
One standout feature is TradingView's extensive library of technical indicators—over 100 built-in, with hundreds more crafted by the community. Whether you’re into moving averages, Bollinger Bands, RSI, or MACD, you can tailor your charts to what fits your trading style best. Say you’re trading indices on Deriv and want to validate signals with RSI and moving average crossovers; TradingView lets you apply and tweak those indicators in real time to support your analysis.
Sometimes, raw numbers don’t tell the full story. TradingView’s advanced visualization tools, like colored candles and volume profile charts, highlight market momentum and support-resistance areas vividly. This makes it easier to read the market’s heartbeat at a glance. For example, a trader in Karachi noticing a volume spike on NIFTY futures can quickly decode potential reversals or breakouts, helping them time their trades better on Deriv.
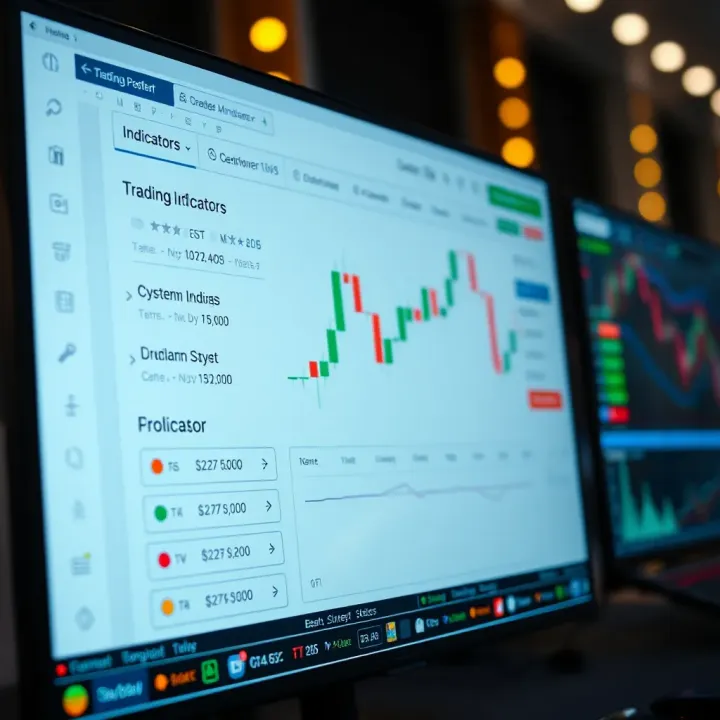
Embedding TradingView charts into Deriv means you’re not juggling multiple interfaces. This smooth integration lets traders view and interact with detailed charts right inside the Deriv environment. It’s like having a cockpit dashboard where all the important instruments are in one place, reducing distraction and mistakes.
Speed counts in trading, especially when markets move fast. TradingView’s chart data updates in real time, ensuring that what you see on Deriv is current. No guessing games over stale data — every tick, candle, and volume bar reflects up-to-the-second market activity. This is particularly crucial for high-frequency trading or scalping strategies commonly used by active Pakistani traders.
One size doesn’t fit all in trading. TradingView lets you customize chart layouts, colors, and indicators, matching your personal preferences and trading tactics. Whether you’re a day trader who wants minute-by-minute updates or a swing trader looking at daily trends, adjusting your workspace means trading feels less like a chore and more intuitive. Even novice traders find it easier to learn and adapt thanks to simple customization options.
Combining TradingView’s powerful analytics with Deriv’s versatile platform creates an environment where Pakistani traders can analyze markets quickly and act decisively — essential steps to trading success in today’s fast-moving financial markets.
Before jumping into chart integration and complex analysis, setting a solid foundation with TradingView and Deriv is key. Getting started means creating the right TradingView profile tailored to your trading needs and understanding how Deriv functions as your trading hub. This ensures you don't just have bells and whistles but tools that fit your style and enhance decision-making.
Signing up on TradingView is straightforward but getting it right matters. You'll start by entering your email, creating a username, and choosing a strong password. After confirming your email address, you get access to a vast collection of charts and tools. For Pakistani traders, it's handy that TradingView supports local currency views, making your analysis more relatable. Once registered, take some time to explore demo charts or public ideas shared by other traders — it’s like a sneak peek into the trading community’s playbook.
TradingView offers several plans — from free to premium tiers. For casual users, the free plan covers a lot, including basic charts and a limited number of indicators. But if you want to link your charts directly into Deriv or use more complex tools like multiple chart layouts and extended indicator sets, upgrading helps. Premium plans also remove ads, saving you from distractions during intense trading sessions. As many local traders balance cost and benefit, starting free then stepping up when you find value is a smart move.
Deriv isn’t your run-of-the-mill trading platform; it caters to different tastes. You can trade options like Forex, CFDs, and synthetic indices, each with its quirks. For example, synthetic indices are particularly popular for round-the-clock trading and don’t depend on real-world market hours — good for anyone needing flexibility. Knowing which products to focus on will guide how you use your TradingView charts — candlestick patterns might suit Forex, while custom indicators help with synthetic indices.
Opening an account on Deriv’s platform is pretty quick but requires some paperwork. Provide your basic information and verify your identity to comply with local regulations. This step’s crucial to avoid account freeze or withdrawal issues later on. It’s best practice to enable two-factor authentication right away — this adds a layer of protection that’s worth the tiny extra effort. Once set up, you can immediately test your account with a demo balance. This practice run helps familiarize with trading options and the interface before committing real funds.
Getting your basics right with TradingView and Deriv means smoother sailing ahead. Without solid accounts and platform understanding, even the best analysis tools can fall short.
By following these initial steps carefully, you set the stage for a more effective, stress-free trading experience under the Pakistani market context, where understanding local compliance and platform capabilities can make a noticeable difference.
Integrating TradingView charts directly into the Deriv platform is a game changer for traders. It puts powerful, detailed analytical tools right where you’re making your trades—no need to juggle different apps or screens. Embedding these charts means smoother workflows and faster decision-making, especially when market conditions shift rapidly.
By having TradingView’s advanced visuals and indicators alongside Deriv's trading features, users can spot trends and opportunities more clearly. For example, a trader focused on forex might embed a live EUR/USD candlestick chart with key indicators like RSI and Bollinger Bands to get real-time insight without leaving Deriv. This tight integration can shave seconds off analysis time—a critical edge in fast markets.
Finding the chart widgets you need starts at TradingView’s website. They offer various embeddable widgets — from full-featured charts to simpler market overview windows. The key is to navigate TradingView’s "Widgets" section, usually found in the site’s footer or under tools. There you’ll see options like Interactive Chart, Market Overview, and Mini Chart.
Selecting the right widget depends on your trading style. For instance, the Interactive Chart widget allows deep customization with many indicators visible. It’s perfect if you want the full TradingView experience embedded. Meanwhile, the Market Overview is simpler and helps monitor multiple assets at once.
When choosing charts for Deriv, it’s important to pick those that complement the platform’s trading options. Since Deriv supports options and multipliers primarily on forex, commodities, and indices, focus on widgets that display these markets well.
For example, using a candlestick chart with volume and moving average overlays suits short-term options trading. Also, consider the chart update frequency—real-time or near real-time feeds help you stay on top of rapid price moves. Avoid charts designed for longer-term analysis if you trade short bursts on Deriv’s platform, as that might slow your reactions.
Once you’ve picked your widget, generating the embed code is straightforward. After selecting the widget type and customizing size, style, or indicators on TradingView’s widget page, you get a snippet of HTML code.
This usually looks like a block of iframe> code that you can copy. Make sure to adjust parameters like width and height to fit Deriv’s layout. For example:
html iframe src="https://s3.tradingview.com/embed-widget/." width="600" height="400">iframe>
This code snippet acts like a window showing your chosen TradingView chart wherever you add it.

#### Inserting code into Deriv platform or custom interfaces

Inserting this embed code into Deriv itself depends on your setup. Deriv’s standard platform may not support direct HTML embedding, so commonly traders add the TradingView widget into custom dashboards or browser extensions that overlay on Deriv.

For those building custom interfaces—like a personal trading dashboard using Deriv and TradingView APIs—the `iframe>` goes into your web app’s code. Alternatively, using browser plugins such as Stylish or custom scripts, you can inject these widgets alongside Deriv’s trading panel.

One practical tip: test the widget in a separate HTML file first to confirm the chart loads correctly before integrating it with Deriv. This avoids disruptions during live trades.

> Embedding TradingView charts isn’t just a tech task; it’s about making data work for you in real time. A well-chosen, properly embedded chart can be the difference between a good trade and a missed opportunity on Deriv.

By following these steps, Pakistan traders can enhance their workflow significantly, gaining sharper insights without juggling multiple tabs or apps. This approach keeps analysis and execution deeply connected, making trading smarter and quicker.

## Customizing TradingView Charts for Enhanced Analysis

When you’re trading on Deriv, one size definitely doesn’t fit all when it comes to charts. Customizing TradingView charts is about tweaking visuals and indicators to match your own style and strategy. The benefit? You get clearer signals and a setup that lets you spot opportunities faster without hunting through clutter.

For example, a trader focusing on short-term forex moves might want charts with specific indicators like RSI or moving averages, while a cryptocurrency enthusiast might prefer different chart types for better volatility analysis. This customization translates to better decision-making especially when milliseconds count in trading.

> Customization isn't just about aesthetics—it’s a tool to sharpen your market analysis and reduce the noise that can lead to poor trades.

### Applying Technical Indicators

Technical indicators are the bread and butter of chart analysis, and choosing the right ones is key for Deriv traders. Popular indicators include:

- **Moving Averages (MA):** These smooth out price data to identify trends over time, essential for spotting entry and exit points.
- **Relative Strength Index (RSI):** Measures momentum to help spot overbought or oversold conditions.
- **Bollinger Bands:** Shows volatility by placing bands above and below a moving average, helping traders understand price ranges.
- **MACD (Moving Average Convergence Divergence):** Helps identify trend direction and momentum changes.

By combining these indicators, traders on Deriv can build a clear picture of market momentum and potential reversals.

Adding and tweaking these indicators on TradingView charts is straightforward. Once your chart is open, click the “Indicators” button and search for your preferred tool. You can then adjust settings like periods or levels to suit your trading horizon. For example, a scalper might use a 5-period MA, while a swing trader might prefer 20 or 50.

Don't forget, indicators are aids, not oracles. It’s wise to cross-check signals from multiple sources to avoid misreads.

### Adjusting Timeframes and Chart Types

Choosing the right chart type is a simple change that can make a big difference. TradingView offers candlestick, line, and bar charts, each with its pros:

- **Candlestick charts** show open, high, low, and close prices. The color cues help quickly identify bullish or bearish moves. These are favorites for most traders because they convey more information.
- **Line charts** connect closing prices, offering a cleaner, simpler view but less detail. These are good for spotting long-term trends.
- **Bar charts** display similar info to candlesticks but in a different format, favored by those who study price action in detail.

Picking the right timeframe also ties into your strategy. For day trading or scalping on Deriv, timeframes like 1-minute, 5-minute, or 15-minute charts are common since they capture quick price moves. For swing trading, using hourly or daily charts makes more sense, as they smooth out the noise and focus on bigger trends.

Here’s a quick rundown:

- **Short-term (Scalping):** Use 1-5 minute charts.
- **Medium-term (Day trading):** Use 15-60 minute charts.
- **Long-term (Swing/Position trading):** Use daily or weekly charts.

Adjusting charts this way on TradingView embedded in Deriv lets you tailor the pace and depth of your analysis, a real edge in volatile markets.


Mastering customization on TradingView charts within the Deriv platform puts powerful analysis tools at your fingertips, tailored to your own style. This not only boosts trading accuracy but also builds confidence by giving you charts that speak your language and fit your approach.

## Tips for Using TradingView Efficiently with Deriv

Getting the most out of TradingView when paired with Deriv takes more than just embedding charts. You want to make sure your setup runs smooth and that you’re taking full advantage of the analytical tools available. This doesn’t just save time but can seriously improve your decision-making in the heat of trading. In this section, we’ll cover some practical tips and common pitfalls to watch out for, so you aren’t caught off guard when the market gets choppy.

### Avoiding Common Setup Errors

#### Ensuring Compatibility Between Platforms

Before you dive in, it’s important to confirm that TradingView's chart widgets play nicely with Deriv’s platform. TradingView updates its widget codes and API frequently, so using outdated embed codes might cause charts not to load properly or show stale data. For instance, some traders just embed the HTML code without double-checking if Deriv’s current environment supports all the widget’s features—this can lead to broken charts.

Make sure your browser supports iframes (used by TradingView widgets), and consider the platform’s requirements for JavaScript. Testing the chart embed on a dummy Deriv account first can prevent headaches. Also, keep in mind that mobile and desktop views may behave differently, so check compatibility on both to avoid surprises when trading on the go.

#### Checking Data Refresh and Sync Issues

Nothing is worse than spotting a trend late because your chart didn’t update on time. Sometimes, charts embedded from TradingView may not reflect real-time prices perfectly on Deriv, especially during high volatility periods. This lag happens because of the time it takes for data to refresh between TradingView and your Deriv interface.

To tackle this, regularly reload your charts or set up automatic refreshes if your setup allows it. TradingView’s alerts can also help alert you when price levels are hit, mitigating the risk of missing moves due to slight delays. Additionally, aligning time zones correctly for both platforms is crucial—mismatches here can skew your analysis.

### Maximizing Analytical Capabilities

#### Using Alerts and Drawing Tools

TradingView shines with its alerts and intuitive drawing tools, which can boost your edge when trading on Deriv. You can set price alerts on TradingView for specific levels so you don’t have to stare at screens all day. This way, if the market hits your entry or stop-loss level, you get notified instantly, allowing timely decisions.

The drawing tools let you mark trendlines, support and resistance zones, or Fibonacci retracements directly on your charts. When combined with Deriv’s trading options, these visuals help you craft precision strategies. Don’t be shy about using colors or different shapes to represent different market conditions—a quick glance can tell a whole story without digging deep.

#### Saving Chart Layouts for Quick Access

Once you invest time customizing your charts with the indicators and drawings that suit your strategy, saving those layouts is a real time saver. TradingView lets you save your chart setups so you can switch between different instruments or strategies without starting from scratch.

Imagine you focus on forex pairs during Asian sessions and indices during European hours—you can have separate saved layouts for each, pre-loaded with the relevant timeframes and technical indicators. This way, switching between your preferred analysis styles happens in a snap, keeping you agile throughout the trading day.

> A well-prepared trader saves both time and energy, which often translates directly into better trade outcomes.

Keeping these tips in mind will help you unlock more value from TradingView’s advanced charts while enjoying Deriv’s flexible trading options. Remember, a smooth setup combined with smart analytical tools is a big step forward in smart trading.

## Addressing Challenges and Troubleshooting

Dealing with hiccups while blending TradingView charts with the Deriv platform is inevitable. Knowing how to address these problems without losing your cool is just as important as setting up charts in the first place. When traders face issues like slow loading charts or data lag, it can disrupt decision-making and lead to missed market opportunities. Plus, compatibility quirks with different browsers can add another layer of frustration.

Taking the time to understand common obstacles and practical fixes will not only keep your trading workflow smooth but also boost your confidence in using both platforms efficiently. In many cases, simple adjustments or workaround tricks can save you from pulling your hair out on a trading day.

### Handling Connectivity and Performance Issues

**Troubleshooting slow chart loading** is a common headache, especially when trading on platforms that rely on real-time updates. If you notice your TradingView charts embedded in Deriv are sluggish, it’s often linked to internet connectivity problems or excessive browser cache.

Try clearing your browser's cache and disabling any heavy browser extensions that might be hogging resources. Also, switching to a wired connection instead of Wi-Fi or restarting your router can sometimes make a noticeable difference. For example, a trader in Karachi reported that disabling browser add-ons drastically sped up chart rendering, making their analysis far less stressful.

**Dealing with data lag on Deriv** affects the accuracy of real-time price movements, making timely trading decisions tricky. This lag can happen due to server overloads, network delays, or even your device’s processing power.

One practical tip is to monitor your system’s resource usage; closing unnecessary programs during trading sessions can help. Additionally, keeping your Deriv app or browser tab refreshed periodically ensures you’re not stuck with outdated information. In Pakistan, where internet speed varies widely, picking off-peak hours for trading could reduce data lag significantly.

### Compatibility Concerns and Workarounds

**Browser issues with embedded charts** pop up when certain web browsers don't fully support TradingView widgets embedded in Deriv. Common signs include distorted charts, missing tools, or unresponsive interfaces.

Using widely supported browsers like Google Chrome or Mozilla Firefox often clears these problems. If you face consistent issues on a particular browser, switching to another one for your trading sessions is a straightforward fix. Updating your browser to the latest version is another must; outdated software often struggles with modern web technologies.

**Alternative methods for chart viewing** come into play when embedding doesn’t perform well or isn’t an option. For instance, some traders prefer having TradingView open in a separate window or monitor while executing trades on Deriv.

This method lets you use the full range of TradingView features without worrying about embedding glitches. It's also useful if your device struggles to handle both platforms at once—splitting tasks between applications can lighten the load. Another workaround is to use TradingView’s desktop app alongside Deriv’s web platform, which sometimes offers more stable and responsive charting.

> Addressing these technical nuances head-on equips traders with smoother experiences and reduces disruptions, ensuring better focus on market moves and trading strategies.

## Regulatory and Compliance Considerations for Pakistani Traders

When trading on platforms like Deriv combined with TradingView’s analysis tools, Pakistani traders must navigate a careful path through regulatory and compliance issues. These considerations aren’t just legal formalities; they protect your investments and help keep your trading activities above board. Ignoring them can lead to penalties, frozen accounts, or losing access to key features that can make or break your trading success.

### Trading Regulations Relevant to Deriv Usage

#### Complying with local trading laws

Trading with Deriv from Pakistan means you need to be aware of the country’s stance on online trading and forex activities. Pakistan’s Securities and Exchange Commission (SECP) has strict guidelines on how foreign trading platforms can operate and which financial products residents are allowed to access. For example, many brokers must be licensed or approved to legally offer their services to Pakistani traders. Failing to comply could result in restrictions or legal issues.

To stay clear of trouble, always check if Deriv or its third-party providers comply with local regulations. Also, avoid any shady shortcuts like using VPNs to bypass geoblocking; this could land your account under scrutiny or lead to irreversible shutdowns. Keep records of transactions and account activities in case you need to demonstrate compliance.

#### Understanding trading limits and taxation

Pakistan's tax authorities require traders to report gains from foreign trading platforms like Deriv. While the tax framework is still catching up with digital trading, profits from online trading are generally considered taxable income. Not knowing this can lead to penalties, interest charges, or audits.

The government may impose restrictions on the amount you can transfer internationally or the volume of trades allowed in certain circumstances. For instance, overzealous trading without declaring income might set off alarms with banks or regulatory bodies.

Here’s a straightforward rule: always declare your trading profits in your income tax returns and maintain a clear log of deposits, withdrawals, and trades. Consult a local tax expert to understand any specific trading limits or reporting requirements that might affect your use of Deriv.

### Ensuring Secure and Responsible Trading Practices

#### Protecting personal data

Your personal information on platforms like Deriv and TradingView holds the key to your financial life. For Pakistani traders, it’s important to be vigilant about where and how your data is stored and shared, especially since local laws are evolving around data privacy.

Use strong, unique passwords and turn on two-factor authentication (2FA) to guard your accounts. Avoid using the same login details across multiple sites. Be wary of phishing attempts or fake websites pretending to be Deriv or TradingView. Nobody wants their account hijacked just because they clicked on a dodgy email link.

Make sure your computer and any device you use for trading have up-to-date security software. This isn't just for peace of mind—it's a must-have to protect your identity and funds from cyber thieves.

#### Using secure connections when trading

Trading involves transmitting sensitive data and real-time orders. Pakistani traders should ensure their internet connection is not only fast but safe. Using public Wi-Fi or unsecured networks can expose your account to interception and hacking.

Whenever you log in to Deriv or TradingView, prefer private networks, ideally your home Wi-Fi with a strong password. Consider using a Virtual Private Network (VPN) that does not violate platform policies to add a layer of security when you’re out and about.

> Staying secure isn’t just about avoiding hacks—it also means preventing delays and disruptions that can cost you money. A stable, secure connection ensures your trades execute at the prices you expect.

By responsibly managing your digital security and following Pakistan’s trading laws, you create a safe environment for your investments. This care helps leverage the combined power of TradingView charts and Deriv’s platform without unexpected setbacks or legal headaches.📈 Learn how to connect TradingView with Deriv for smarter trading. Step-by-step setup, pro tips, and solutions for smoother trades in Pakistan.
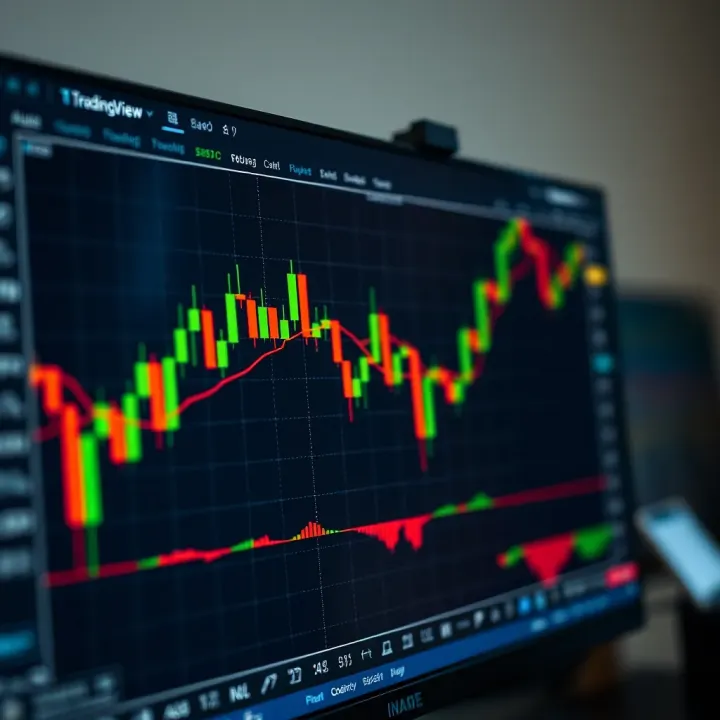
📊 Discover how to combine TradingView's charts with Deriv's platform for smarter trading decisions. Learn setup tips and get the edge in Pakistan markets!
📊 Learn how to use TradingView for binary options with expert tips on charting, indicators, strategies, and risk management to boost your trading skills.
📊 Dive into TradingView.com’s features for smart market analysis—real-time data, customizable charts, social tips, and a guide to free vs paid plans! 📈
Based on 5 reviews