
TradingView Guide for Traders in Pakistan
📊 Discover how TradingView empowers traders in Pakistan with advanced charts, indicators, broker integration, and mobile tools for smarter market moves!
Edited By
Ethan Murray
Understanding markets is never just about staring at numbers or random charts—it’s about spotting real trends, catching signals before others do, and making decisions that count. TradingView charts give traders and investors a powerful edge by putting all the tools and visuals they need right at their fingertips.
In Pakistan's bustling market scene, where stocks, forex, and crypto trades happen fast, mastering TradingView charts becomes more like a necessary skill than a luxury. Whether you’re a newbie trying to learn the ropes or a seasoned player looking to sharpen your strategy, getting familiar with these charts can make a big difference.
This guide focuses on practical use—breaking down features and customization options that let you tailor charts to what matters most to you. From basic chart types to advanced indicators, and even drawing tools, we’ll cover everything that helps turn raw data into actionable insight.
With the right approach to TradingView charts, Pakistani traders can filter through the noise, spot trends early, and make smarter investment calls.
By the end, you should feel confident navigating and using TradingView’s charting platform to analyze markets and devise strategies that fit your trading style. Let’s roll up our sleeves and get started.
Understanding the basics of TradingView charts is the first step towards becoming a more effective trader. TradingView provides a platform where traders can monitor market movements, analyze trends, and make decisions based on real-time data. This section covers the foundation of what TradingView charts are, which markets you can track using them, and why many traders, especially in Pakistan, prefer this tool for their trading routines.
TradingView charts are digital tools that display the price and volume data of various financial instruments over time. Their main purpose is to help traders visualize market trends, spot potential trading opportunities, and track price movements with accuracy. Imagine watching the ups and downs of a cricket score to decide when to cheer or stay silent; similarly, TradingView charts show market rhythms and help traders decide when to buy or sell.
For example, a Pakistani investor trading in the PSX (Pakistan Stock Exchange) can easily use a TradingView chart to watch the price fluctuations of popular stocks like Lucky Cement or Habib Bank Limited, which helps in making informed decisions.
TradingView is not limited to one specific market. It supports a wide range of financial markets, including but not limited to:
Stocks (local and international, like Apple and PSX shares)
Forex pairs such as USD/PKR
Cryptocurrencies like Bitcoin and Ethereum
Commodities including gold and oil
Indices such as Dow Jones and KSE-100
This broad coverage means that whether you’re interested in the Karachi stock market or the global crypto scene, TradingView charts give you the tools under one roof, saving you the hassle of juggling multiple platforms.
One reason traders love TradingView is its clean and intuitive interface. Unlike complex software that feels like solving a tough puzzle, TradingView’s design makes navigation straightforward. Even beginners can quickly learn to pull up charts, add indicators, or draw trendlines without feeling lost in menus.
For instance, a trader wanting to analyze the RSI (Relative Strength Index) on the HBL stock chart can simply select the indicator from the sidebar and see immediate results, without fiddling through layers of options.
TradingView’s cloud-based platform means you can access your charts anytime, anywhere, whether on a desktop at work or on a mobile during a commute. It syncs your settings and saved charts automatically, so you never lose track of your setups.
Moreover, TradingView integrates seamlessly with many brokers—making it possible for users in Pakistan to connect their brokerage accounts, place trades directly from charts, and keep everything tightly linked. This convenience cuts down the time between spotting a signal and acting on it, which can be a game-saver in fast markets.
In short, TradingView isn’t just about pretty charts; it’s about making smart, timely decisions with tools designed for real-world trading demands.
Understanding the variety of chart types available in TradingView is key for any trader or investor looking to make informed decisions. Each chart type serves a specific purpose and suits different trading styles and market conditions. By identifying the right chart type, traders in Pakistan can tailor their analysis for stocks, forex, or commodities, making the process smoother and more aligned with their strategies.
Structure and interpretation: Candlestick charts display price movements over set periods using "candles" that show open, high, low, and close prices. Each candle consists of a body and wicks (or shadows), where the body reflects the difference between opening and closing prices, and the wicks represent the extremes. For example, if the closing price is higher than open, the candle is often green (bullish); if lower, it’s red (bearish). This visual format helps traders quickly spot patterns and momentum, such as bullish engulfing or hammer candles, which often signal trend reversals or continuations.
Benefits for traders: Candlestick charts offer more insight than simple lines. They provide context, showing not just direction but also market psychology behind price moves. For instance, during periods of indecision, you might see doji candles where open and close prices are nearly the same, signaling possible trend changes. This richer detail allows traders to time entries and exits better, reducing guesswork.
Differences and uses: Line charts connect closing prices over time with a simple line, stripping away price fluctuations in between. They're great for spotting general trends when you’re not interested in the day-to-day volatility. Bar charts, on the other hand, provide more detail: each bar shows opening, high, low, and closing prices similar to candlesticks, but with a different visual style (a vertical line with horizontal ticks). The bar's left tick shows open price, and right tick shows close.
When to choose each type: Use line charts when clarity and simplicity matter, such as during initial research to catch overall direction. Bar charts may suit traders who want detailed price action but prefer less color coding or different visual cues than candlesticks. For example, swing traders might prefer bar charts for spotting support and resistance with clear high/low markers.
Heikin Ashi: This chart smooths price data by averaging open-close prices and using modified calculations for highs and lows. The result? Fewer false signals and trends that look smoother, helping traders stick to moves without getting whipsawed by noise. For example, in volatile Pakistani stock markets, Heikin Ashi can help identify the strength of a trend more clearly, making it easier to hold positions.
Renko and Point & Figure charts: Renko charts ignore time and focus only on price movement, creating blocks when a set price change occurs. This filters out minor fluctuations, highlighting strong trends. Point & Figure charts, similarly, focus on price direction by plotting Xs and Os to represent rising and falling prices without considering time either. Both chart types are excellent for traders wanting to filter out market noise and spot support, resistance, or breakout levels quickly.
Different chart types give you different lenses to view the market. Experimenting with them can reveal fresh perspectives that might be missed if relying only on one style.
By choosing the right chart type on TradingView, Pakistani traders can better match their analysis approach with market conditions, improving the chances of making well-timed and informed trades.
Getting your TradingView chart set up right is like laying the groundwork for a solid trading strategy. Without a proper setup, the details get lost in a jumble, making it harder to read the market's signals and react in time. Setting up your chart involves picking the right market and timeframe, then tailoring the visual layout to your taste and trading style.
Think of it as adjusting your workspace before diving into the day’s work — a few tweaks here and there save a lot of hassle later.
First things first: finding the exact instrument you want to track or trade. TradingView covers stocks, forex, cryptocurrencies, futures, and more, but narrowing down your instrument fast is a game changer. Use the search bar at the top to type in tickers, company names, or currency pairs. For example, typing "PSX" quickly pulls up Pakistani stocks listed on the Pakistan Stock Exchange.
This feature helps traders avoid clutter and focus only on relevant assets. If you’re tracking the Karachi market, jumping between local stocks like OGDC or HBL is seamless.
Next is picking a timeframe that matches your trading style. Day traders often zoom into 5-minute or 15-minute charts to catch quick moves, while long-term investors might stick with daily, weekly, or even monthly intervals.
Choosing the right interval keeps your analysis relevant; looking at a 1-minute chart for a swing trade can be like using a microscope to spot a forest fire – detailed, but missing the bigger picture.
Pro tip: start with what feels intuitive and adjust as you understand how price action unfolds in your chosen market.
Customizing colors isn't just about making your chart look pretty. It helps you interpret the data faster. For instance, some traders prefer green and red candlesticks, but if red’s too harsh, switching to softer shades or even blue and orange can ease eye strain.
TradingView lets you fiddle with bar colors, candle wick styles, and backgrounds — each change influencing how quickly your brain processes market movement.
For example, setting up a dark background with bright neon colors might be ideal for those late-night chart sessions.
The grid lines and scales might seem minor, but they anchor your interpretation of price levels and patterns. You can turn grid lines on or off or adjust their density to reduce chart clutter.
Scales determine how price data fits on your screen. Logarithmic scales are handy when you’re dealing with assets that have moved dramatically over time, like Bitcoin, whereas linear scales do fine for steady stocks.
A well-configured grid and scale setup can prevent you from misreading trends or confusing noise for meaningful moves.
Remember, the goal is to make the chart work for you — clarity and comfort beat flashiness any day.
Overall, taking the time to properly set up your TradingView chart boosts confidence when reading market signals and making decisions. Small investments in setup can save big headaches down the road and sharpen the accuracy of your trading calls.
Indicators and drawing tools are the bread and butter when analyzing charts on TradingView. They help traders spot trends, measure momentum, and identify key price levels, giving a clearer picture of potential market moves. Without these tools, charts might just look like a bunch of squiggly lines without meaning.
Using indicators like moving averages or RSI can bring clarity to a confusing market, helping traders make informed decisions. Drawing tools, on the other hand, allow you to mark important areas directly on the chart, making it easier to plan entries and exits or spot breakouts.
Moving Averages
Moving averages smooth out price data to create a single flowing line that indicates the overall direction of the price. They're simple but powerful, showing whether an asset is trending up, down, or sideways. For example, a 50-day moving average crossing above the 200-day moving average often signals a bullish market, known as a "golden cross." Pakistan’s active stock traders often watch these crosses to spot good buying opportunities.
Additionally, moving averages come in different flavors: simple moving average (SMA) gives equal weight to all periods, while exponential moving average (EMA) gives more importance to recent prices. Using EMAs can be helpful in volatile markets, like the currency pairs involving the Pakistani rupee, where recent price actions matter more.
RSI and MACD Basics
The Relative Strength Index (RSI) helps spot when an asset is overbought or oversold by measuring the speed and change of price movements. RSI values above 70 suggest the asset might be due for a pullback, while below 30 can point to a potential bounce. It's valuable for traders who want to time their entries better, especially in choppy markets like commodities or stocks in Pakistan’s KSE 100.
MACD (Moving Average Convergence Divergence) shows the relationship between two moving averages and helps identify momentum shifts. When the MACD line crosses above the signal line, it's often a buy signal; the opposite crossover is a sell signal. Pakistani traders use MACD to spot trend reversals with an extra layer of confidence, especially when combined with moving averages.
Trend Lines
Trend lines connect two or more price points to highlight the direction of the market. Drawing a trend line along rising lows shows an uptrend, while one along declining highs shows a downtrend. It’s one of the most basic but effective ways to visually track price movement.
In TradingView, simply select the trend line tool and connect the relevant points. For example, a trader watching Pakistan Stock Exchange may draw a trend line underneath several swing lows of a rising share to identify when the uptrend might break, signaling a possible sell.
Support and Resistance Levels
Support marks a price level where buying interest is strong enough to prevent the price from falling further. Resistance is the opposite—a level that selling pressure keeps price from rising. These levels act like invisible walls for price movement.
Plotting these on your TradingView chart helps identify entry or exit points. For instance, if a particular support level on Engro Fertilizers stock has held multiple times, a bounce off this level might signal a good buying opportunity.
Fibonacci Retracements
Fibonacci retracements are based on key ratios derived from the Fibonacci sequence and are used to predict areas where price may pull back before continuing in the original direction. Typical retracement levels are 38.2%, 50%, and 61.8%.
Say a trader spots a strong upward move in Lucky Cement shares, they can apply Fibonacci retracement levels to see where price might find support during a correction. These levels act like magnets, often slowing or reversing price moves, making them valuable tools for timing.
Drawing tools and indicators are not magic wands, but when combined thoughtfully, they provide a solid foundation for making smarter trades. Traders should also remember to use multiple indicators and drawings together for confirmation rather than relying on just one signal.
By mastering indicators like moving averages and RSI along with drawing effective trend lines and support/resistance levels on TradingView, Pakistani traders can significantly improve their analysis and trade decisions.
TradingView isn't just about making one-off analyses; it shines when you save and organize your chart setups efficiently. Saving layouts means you won’t have to start from scratch every time you log in, saving time and frustration especially if you track multiple markets or assets. Organized layouts allow quick switching between different trading strategies or timeframes, which is a real advantage for busy traders managing portfolios. By keeping your charts tidy and accessible, you reduce errors and better manage your analysis workflow.
TradingView allows you to create numerous chart layouts and save them independently. For instance, you might have one layout focused on forex pairs during Asian market hours and another tracking Pakistani stocks during PSX trading sessions. Switching between these saved setups is as easy as clicking on a tab, so you can adapt your view instantly based on market conditions or trading strategies. It’s like having multiple desks but only one room — neat, quick, and saves a ton of hassle.
Templates are pre-configured chart layouts that you can apply instantly to any new chart. Imagine you have a particular technical indicator combination like an RSI with Bollinger Bands that you swear by. Instead of setting these indicators every time, simply save them as a template. Then, when you open a new chart, apply the template and your preferred settings, colors, and tools are ready-to-go. This cuts down on setup time dramatically and keeps your analysis consistent across different assets.
TradingView makes it simple to share your charts so others can see your analysis or trade ideas. Especially in communities like those in Pakistan, where traders rely heavily on collective wisdom, sharing charts publicly can boost learning and collaboration. You can choose to publish charts with annotations and indicators publicly, allowing community feedback or discussion. This feature turns your private analysis into a shared resource without complicated exports or screenshots.
If you run a blog, financial website, or want to showcase your trading analysis to clients, embedding TradingView charts is a neat feature. It allows you to place interactive charts directly onto your site where readers can zoom, pan, and explore data themselves. This direct embed supports multiple customizations, so the chart style and timeframe fit your site's look and feel. For Pakistani traders and analysts creating content, this feature enhances credibility and engages visitors better than static images or text-based reports.
Saving and organizing your chart layouts isn't a luxury—it's a necessity for efficient trading. Whether switching swiftly between saved setups, using smart templates, or sharing insights publicly, these features help traders stay ahead without getting bogged down by repetitive tasks.
Using alerts and notifications on TradingView can be a game changer for traders, especially in the fast-moving world of finance. Instead of staring at charts all day waiting for the perfect moment, alerts help you stay on the ball and act promptly when price movements or indicator values hit specific levels. This feature is not just convenient—it’s essential for traders who want to stay efficient and avoid missing out on critical opportunities.
Configuring alerts on TradingView is straightforward but highly flexible. You can create alerts based on price crossing above or below a certain value, indicator signals like RSI breaking a threshold, or combinations of technical conditions. For example, if you’re watching the Pakistan Stock Exchange's index and want to be notified when the KSE-100 hits 50,000 points, you set a price alert at that level. This way, regardless of whether you are busy or away, you get a timely notification.
The key here is to tailor alerts to your trading style—day traders might want alerts on short-term timeframes and tight price ranges, while long-term investors might prefer alerts on weekly levels or moving average crossovers.
Managing notification settings is just as important. TradingView lets you choose how you receive your alerts: via app push notifications, SMS, email, or even webhook. This flexibility ensures you’re notified in the way that fits your routine best. For instance, a trader who watches markets on multiple devices can enable push notifications on their phone but disable email alerts to avoid inbox clutter.
Moreover, you can control alert frequency to avoid overload. If a price is bouncing around your alert level, you might not want to get pinged every few minutes. Efficient management helps avoid alert fatigue, keeping notifications useful rather than annoying.
One major advantage of alerts is avoiding missed opportunities. Markets move fast, and price levels can be hit when traders are offline or focused elsewhere. Alerts act like a personal assistant, making sure you never miss that crucial breakout or trend reversal signal.
For instance, consider a trader monitoring the USD/PKR currency pair. If the price approaches a resistance level indicating a possible reversal, an alert set at that point means the trader can jump in right when the action happens rather than catching the move late.
Another benefit is reducing screen time. Constantly monitoring charts is draining, and for many traders, especially those juggling other tasks, it’s not sustainable. Alerts allow you to step away and come back only when your conditions trigger. This can improve focus and prevent burnout, especially during volatile sessions.
In Pakistan’s active trading environment, where sudden news can impact markets rapidly, alerts become a crucial tool. They let you react swiftly without needing to stay glued to the screen all day.
Setting well-crafted alerts on TradingView helps traders act smart, save time, and capture more opportunities—key factors for success in any market.
By mastering alerts and notifications, Pakistani traders and investors can bring discipline and responsiveness into their trading routines without the stress of continuous chart-watching.
Trading directly from charts is a real game-changer for traders who want to make quick, informed decisions without juggling multiple platforms. Instead of flipping between a chart window and a trading terminal, TradingView lets you place and manage orders right on the chart itself. This tight integration saves time and reduces errors, especially in fast-moving markets.
Imagine you’re watching the price action of Pakistan’s most active stock, the Lucky Cement Limited, and you spot a perfect breakout. Instead of leaving the site to place an order elsewhere, you can click straight on the level of your breakout on the chart and enter your trade. This real-time interaction helps traders seize opportunities and manage risk more effectively.
For traders in Pakistan, connecting your local brokerage account with TradingView is essential for trading directly from charts. Currently, broker options are somewhat limited but growing. Brokers such as IG and Saxo Bank support integration with TradingView and offer access to international markets.
More locally focused brokers like AKD Securities and IGI Securities don’t yet have direct TradingView integration, meaning Pakistani traders must either use these platforms separately or explore API connections if available. It’s worth regularly checking TradingView’s broker list as partnerships expand.
Connecting your account directly to TradingView streamlines the trading process, eliminating the need to switch platforms and allowing quick execution based on live chart signals.
When linking your brokerage account to TradingView, security should be your top concern. Connecting accounts usually requires API keys or secure login credentials. Make sure to:
Use two-factor authentication (2FA) on both TradingView and your broker platform.
Never share your login details with anyone or use weak passwords.
Opt for brokers with strong reputations for secure systems and data protection.
Regularly monitor your account for any unusual activity.
TradingView acts only as a bridge for your orders; it doesn’t store your funds, which reduces some risks. Still, proper precautions are needed to avoid unauthorized trades and data breaches.
TradingView supports various order types that can be placed directly from charts, including:
Market orders – executed immediately at the current price, ideal for fast entries.
Limit orders – placed to buy or sell at a specific price, useful to control entry or exit points precisely.
Stop orders – designed to trigger a market order once a certain price level is hit, helping in managing losses or locking profits.
For example, if you want to buy shares of Pakistan Petroleum Limited (PPL) but only when the price dips to a specific level, you can set a limit order right on the chart. The order stays pending until the price hits the set point.
Once orders are placed, keeping track of open positions through the TradingView interface helps stay on top of your trades without needing to log into your broker separately. The platform provides details like:
Entry price
Current profit or loss
Position size
Stop loss and take profit levels if set
Having this info visually layered on the chart means you can quickly adjust stops or take profits based on fresh price action. This visual feedback loop makes trade management smoother and faster.
In summary, trading directly from charts in TradingView is a handy feature that blends analysis and execution into one workspace. Despite current broker limitations in Pakistan, being aware of what’s available and how to maintain security can empower you to trade more efficiently and responsively.
In the fast-paced world of trading, keeping an eye on more than one market at a time can be a real game-changer. It's not just about watching a single stock or currency pair but understanding how several markets interact or move in relation to each other. For traders and investors in Pakistan, this approach helps diversify risk and spot opportunities that might be hidden if you're only focused on one asset.
TradingView makes it easier to track multiple markets by allowing you to set up side-by-side charts. This means you can view, say, the Karachi Stock Exchange index next to the USD/PKR currency pair without flipping between tabs or windows. Setting them side by side helps quickly compare trends, identify divergences, or confirm signals across different markets.
To set up, simply open a new layout and add charts for the markets you want to watch. You can resize each panel so the most important charts get more space, adjusting the view to your preference. For example, a trader may keep an eye on oil prices alongside energy stocks on the Pakistan Stock Exchange to understand how global commodities influence local equities.
Cross-market analysis involves studying how different asset classes or markets affect each other. In Pakistan, for instance, the stock market often reacts to changes in the rupee's exchange rate or commodity prices like wheat or cotton. By analyzing these connections, traders can make informed bets rather than relying on isolated data.
Using multi-chart layouts, you can observe these relationships in real-time. If the currency is weakening but stocks are holding steady, this might signal stability in domestic companies. Conversely, a sudden dip in commodity prices might hint at upcoming challenges for certain sectors. This is where simultaneous viewing becomes not just convenient but crucial for timely decisions.
TradingView allows you to overlay price charts, which means placing one asset’s price on top of another’s for direct comparison. This technique is handy when you want to see how two assets track each other over time, like comparing the performance of the Pakistan Stock Exchange KSE-100 index with international indices such as the S&P 500.
This overlay helps highlight periods when the assets move in sync or diverge significantly, which is valuable for spotting leading or lagging indicators. For example, if the S&P 500 moves upwards and KSE-100 lags, this may indicate potential for growth or signal caution depending on the trader’s strategy.
Understanding the correlation between assets is vital to manage risk and build balanced portfolios. Correlation calculates whether two markets move together (positive correlation) or in opposite directions (negative correlation). For Pakistani traders, knowing how the local market correlates with global commodities, currencies, or equity indexes informs trade timing and diversification.
By using TradingView, you can visualize these relationships easily. For instance, the Pakistan rupee’s correlation with the US dollar or oil prices can be crucial. A high negative correlation between rupee strength and oil prices might suggest that fluctuations in global energy markets will directly impact Pakistan’s currency and, by extension, local stocks.
Tracking multiple markets side by side and comparing their performance helps traders avoid tunnel vision and make balanced decisions rooted in comprehensive market awareness.
In summary, analyzing multiple markets simultaneously using TradingView's flexible tools not only broadens your perspective but sharpens decision-making. It turns data into insight, helping you spot trends, confirm signals, and dodge pitfalls before they happen. For traders juggling different asset types or looking for a bigger picture view, this approach becomes a vital part of everyday strategy.
Understanding how TradingView performs across different platforms is essential for traders who need flexibility and efficiency. Mobile and desktop versions each have their own strengths and quirks, impacting how you analyze the markets and execute trades. Whether you're at your desk digging through detailed charts or catching a quick market update on the go, knowing which platform to use can save you time and even money.
The TradingView mobile app is a solid choice for traders who are often away from their computers. It allows you to check live prices, apply basic technical indicators, and even watch real-time news, all from your phone or tablet. For example, if you're commuting or waiting in line, you can quickly glance at the Pakistani stock market updates or forex pairs without needing your laptop.
One useful feature is the ability to set alerts right from the app, so you won’t miss any critical price movements. The interface remains intuitive despite the smaller screen, making it easier to navigate through different charts or instruments without fuss. This kind of accessibility means you can stay connected with your trading goals without being tied down.
However, the mobile app isn't a complete substitute for the desktop platform. You might find that some advanced chart customization options, like complex multi-indicator templates or detailed drawing tools, are limited or absent. For instance, while you can add moving averages or RSI easily, combining several overlays with custom settings feels clunky or impossible on mobile.
Additionally, managing multiple chart layouts side by side is tricky on smaller screens. This can hinder thorough market analysis or multi-asset comparisons needed for more seasoned traders. If you rely heavily on TradingView’s in-depth features, reserve the mobile app for quick checks and light trades rather than deep research or complex strategy planning.
The desktop version is where TradingView truly shines in terms of capabilities. You get access to a full suite of technical indicators, including niche or custom scripts shared by the TradingView community. For example, Pakistani traders might use custom scripts that factor in local market peculiarities, which only work well on desktop.
Order management and broker integrations also work more seamlessly here. You can place advanced orders like OCO (One Cancels the Other) or bracket orders directly from charts, simplifying trade execution. Plus, the desktop app supports real-time scanning of markets with filters, helping you spot opportunities across different sectors quickly.
Desktop users enjoy extensive options to tailor charts and layouts to their liking. From adjusting every color and line thickness to setting custom time zones matching Karachi Stock Exchange hours, the flexibility is impressive. You can save multiple chart layouts and switch between them instantly, refreshing your workspace without hassle.
Another practical tool is the multi-chart setup, where traders can monitor various asset classes like stocks, commodities, and cryptos side by side. This setup is invaluable for comparing price action and spotting correlations—essential for risk management or diversifying your portfolio.
For Pakistani traders aiming to make informed decisions, the desktop platform offers the depth and precision needed to analyze local and international markets thoroughly.
In short, while TradingView’s mobile app keeps you connected anywhere, the desktop platform delivers the arsenal required for serious trading. Balancing both depending on your situation gives you a practical edge in today’s fast-paced markets.
For traders in Pakistan, tailoring TradingView charts to fit local market nuances can make a big difference. Straight out of the gate, understanding how to adjust for time zones and local data is essential, or else you might find yourself watching charts that don’t quite sync with the actual market timing. Also, there’s a treasure trove of community scripts and shared ideas that often fly under the radar but can give you a serious edge if you know where to look.
It's pretty common for traders to overlook setting their chart time zone correctly. Trading at the right time can be the difference between catching a decent trade or missing the boat entirely. Since Pakistan Standard Time is UTC+5, make sure your TradingView charts are set accordingly. This ensures daily candles open and close in sync with the PSX session hours, giving you accurate signals for intraday or swing trading.
To adjust the time zone, go to the chart settings, look for the "Timezone/Sessions" tab, and select "Asia/Karachi" or manually set UTC+5. This small step keeps everything honest and avoids confusion caused by clock mismatches.
While TradingView covers global markets extensively, local data like PSX stocks, currency pairs (PKR/USD, PKR/EUR), and other region-specific indices might need a little extra attention. Make sure you choose the correct symbol from the Pakistani market listings to avoid mixing up similar ticker symbols from other exchanges.
Moreover, stay updated with local holidays and market closure dates since these affect trading volumes and price movements. You could add the Pakistan Stock Exchange local holidays calendar alongside your watchlist to keep track. That way, you won't mistakenly expect market action on days when the bourse is shut tight.
One of TradingView’s subtle perks is its community-contributed indicators created by traders worldwide, including Pakistani developers who tailor scripts for local trading styles. These might include custom support/resistance calculators that consider the peculiar volatility of PSX or special overlays for forex pairs affected by regional policies.
Digging into these scripts can be done via TradingView’s Public Library. Don’t just stick to popular names; sometimes, lesser-known scripts provide fresher angles or adaptive calculations suited to your trading method. For example, some community scripts adjust RSI sensitivity during Pakistani banking hours, something traditional indicators miss.
Besides tools, the TradingView community shares charts and trade ideas regularly. Following traders who focus on markets relevant to Pakistan can expose you to real-time analysis reflecting local market psychology. It's like having a watchful companion who signals when things get interesting.
Critically, analyze these shared ideas rather than copying blindly—compare them against your own setups. This approach nurtures better judgment and helps you spot patterns unique to the Pakistani context, such as reaction to political news or economic announcements. Plus, discussing these ideas in comments can sharpen your comprehension and connect you with fellow traders.
Remember, local tweaks matter. A chart that doesn’t reflect your market’s reality is just numbers and colors. Setting up your TradingView to mirror Pakistan's market cycles and leveraging community wisdom means you trade smarter, not harder.
📊 Discover how TradingView empowers traders in Pakistan with advanced charts, indicators, broker integration, and mobile tools for smarter market moves!
📈 Explore TradingView charts for detailed market analysis! Learn custom features, indicators & smart strategies to boost your trading skills in Pakistan.
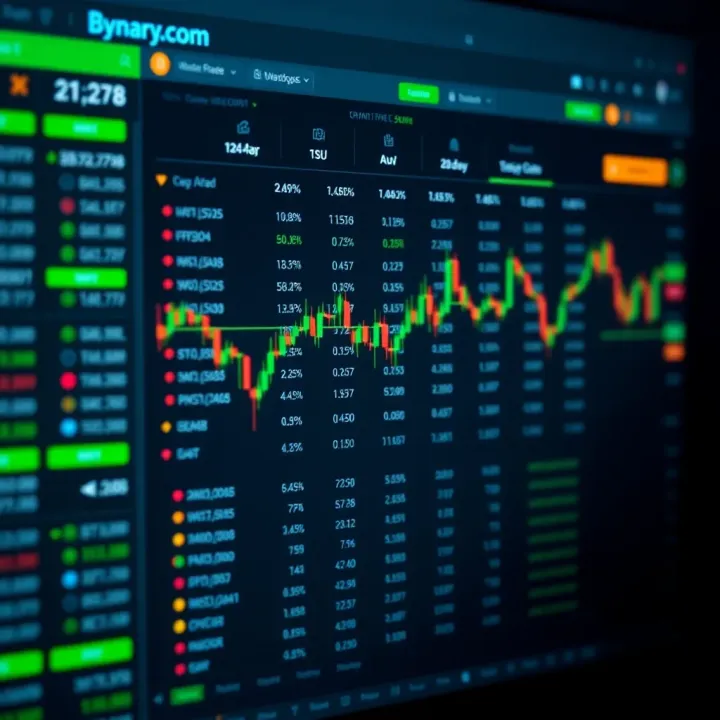
📈 Learn how to integrate TradingView's charts with Binary.com to boost your trading skills in Pakistan. Step-by-step guide with practical tips for success!
📊 Learn how to integrate and customize TradingView charts, use Pine Script, and embed tools in your web apps. Perfect for traders and developers in Pakistan!
Based on 12 reviews